Logical Operations Transforms Tens of Thousands into Microsoft Excel Power Users
Logical Operations’ portfolio of Excel training provides the perfect launchpad for moving students into the in-demand skills of data analysis and data science.
Rochester, NY (PRUnderground) September 15, 2021
From small businesses to Fortune 500 companies, there is one ubiquitous data science and analytics tool: Microsoft® Excel®. Launched more than 36 years ago, Excel is still the most widely used application for data processing, visualization, and complex calculations. Logical Operations’ portfolio of Excel training provides the perfect launchpad for moving students into the in-demand skills of data analysis and data science.
According to the U.S. Bureau of Labor Statistics, 11.5 million new data job openings will be available by 2026. These range from Data Analysts that focus on departmental data specifically, to the more advanced Data Scientist that can take data projects from end to end. Logical Operations’ Excel curriculum has equipped tens of thousands of professionals with the knowledge needed to turn data into actionable insights on the job.
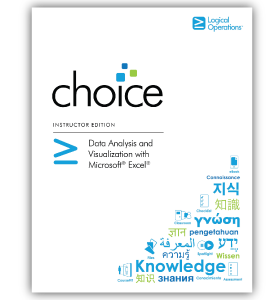
Whether students have little to no experience, or they are experts, Logical Operations’ portfolio of Excel training has something for everyone. Microsoft Excel Parts 1 and 2 cover a foundational framework for the novice user with less complex Excel needs on the job. For the more advanced data professional, Data Analysis and Visualization with Microsoft® Excel® (D.A.V.E.) enables students to perform robust and advanced data and statistical analysis. It also teaches them how to become good data storytellers by visualizing data and insights using advanced visualizations in charts and dashboards.
“The biggest challenge of any Analyst’s daily activity is preparing data for analysis,” explains Jim Gabalski, Logical Operations’ Vice President of Sales and Marketing. “This involves extracting data from disparate systems and creating an analytical dataset. The second biggest challenge is performing the analysis using advanced functions in Excel. And the third biggest challenge is creating impactful, story-telling visuals. Along with foundational data analysis skills, D.A.V.E. addresses data prep, data analysis using Excel functions, and advanced visualizations, such as geospatial charting.”
To learn more about Logical Operations’ Excel content portfolio, visit https://store.logicaloperations.com/catalogsearch/result/?q=Excel.
Distributed via PR Underground